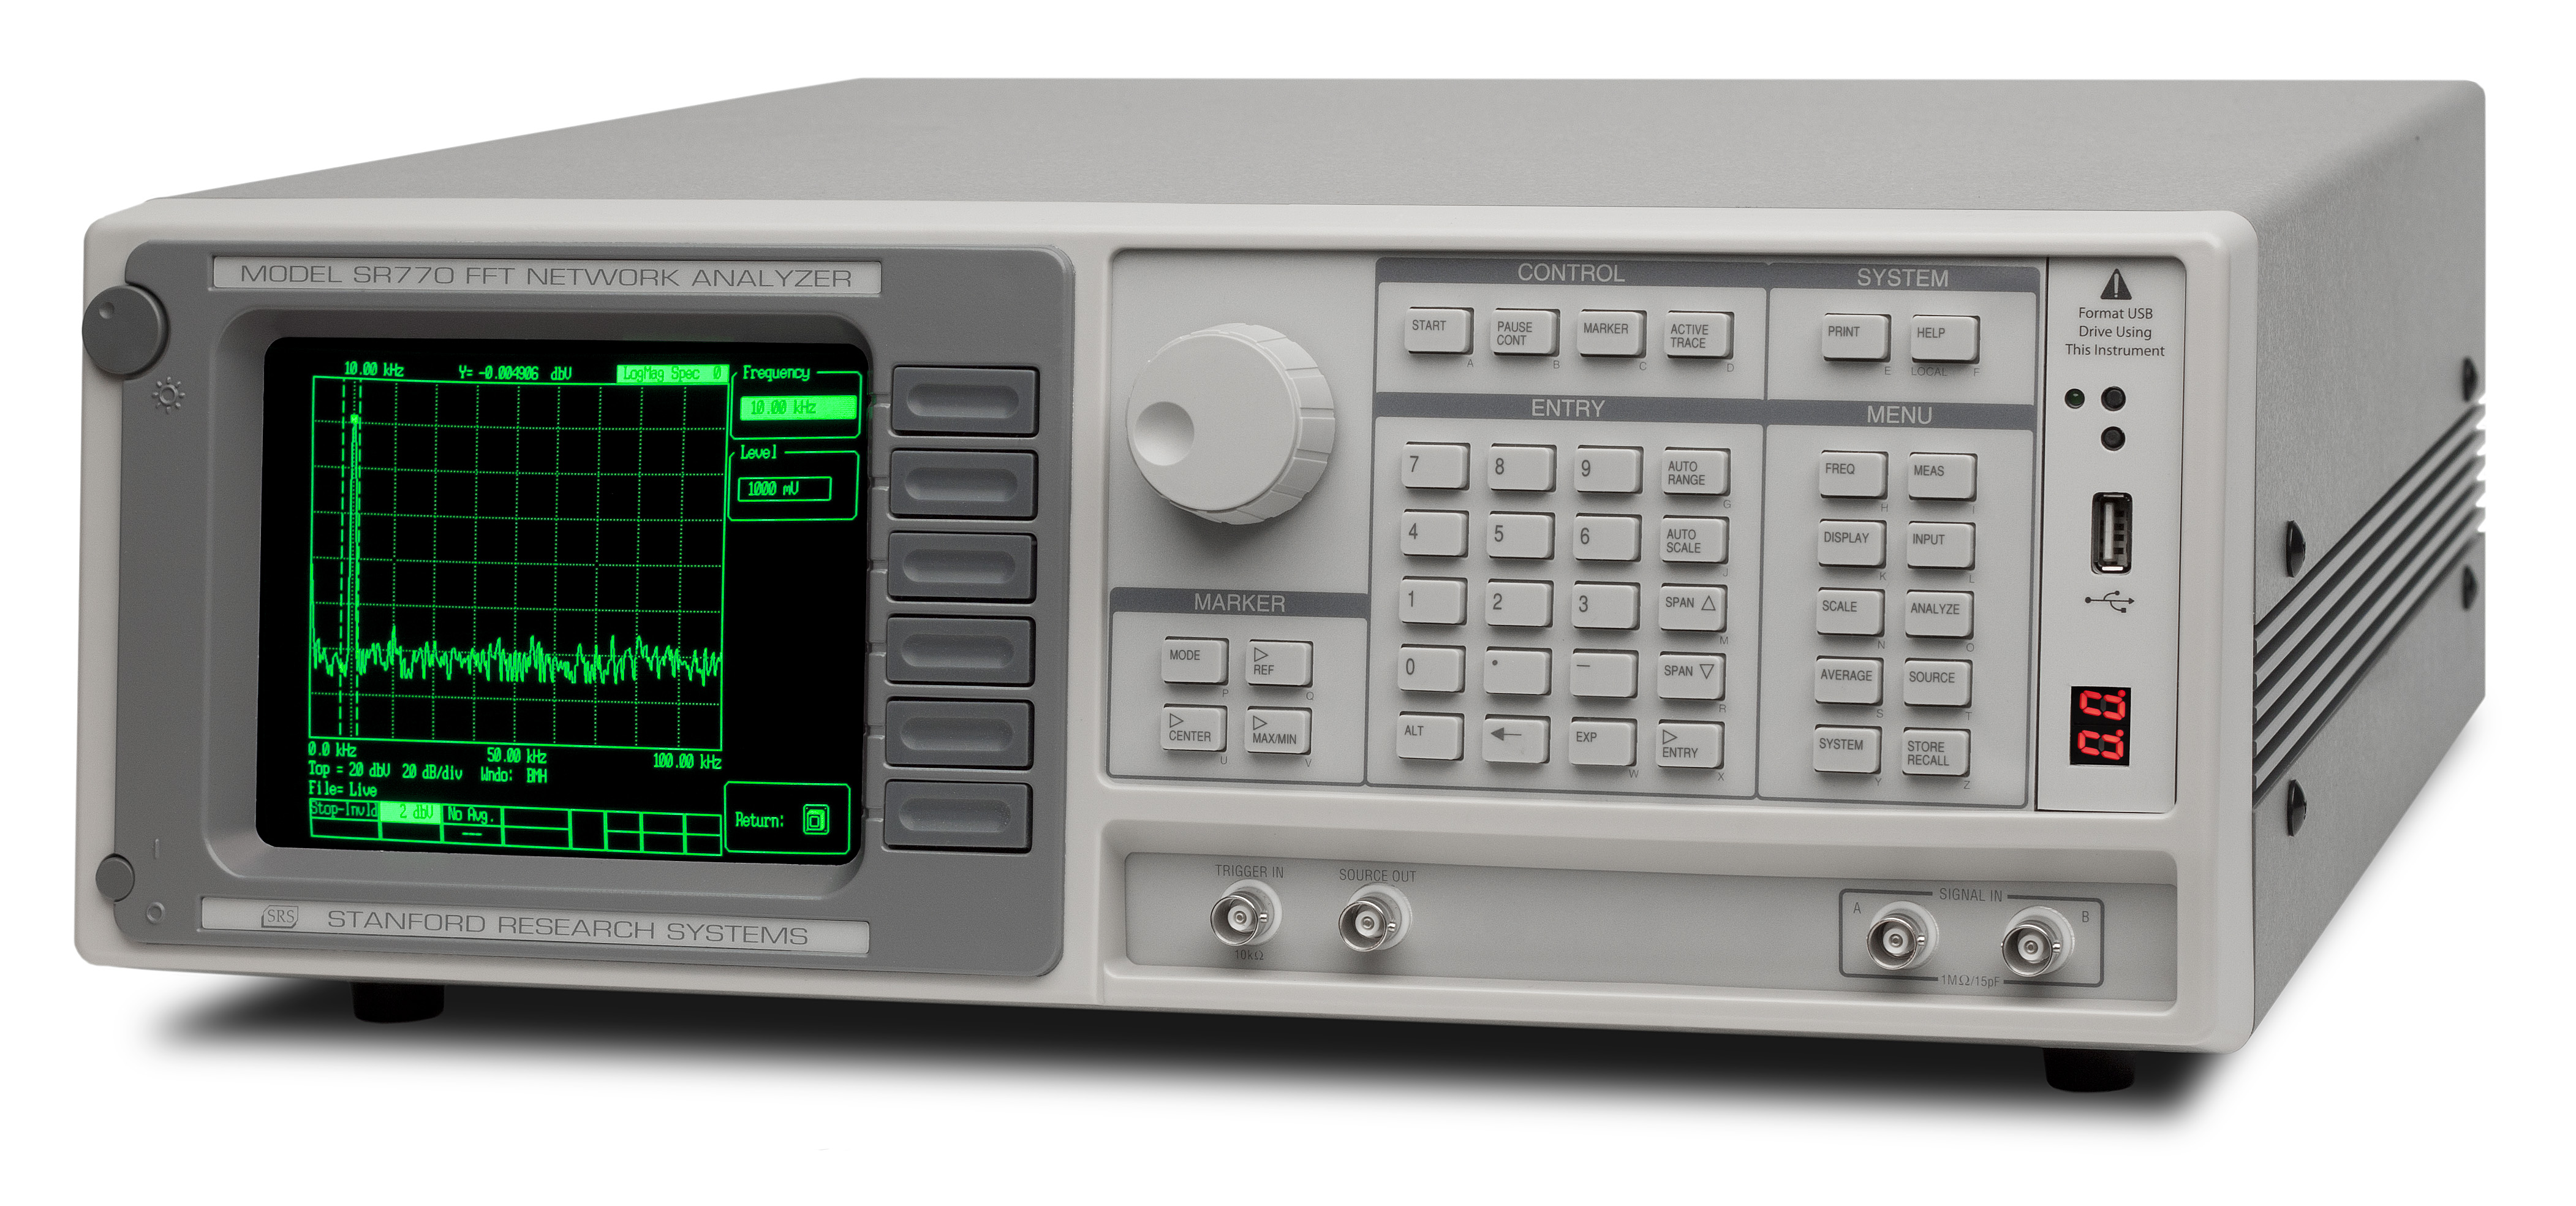
info@thinkSRS.com (408) 744-9040
(408) 744-9040
Home > Products > Test & Measurement > SR770
FFT Analyzer
SR770 — 100 kHz FFT analyzer
SR770 ... from  $10,950
FFT Analyzer
SR770 — 100 kHz FFT analyzer
SR770 ... from   $10,950
 
BUY / QUOTE
BUY / QUOTE
  • DC to 100 kHz bandwidth
  • 90 dB dynamic range
  • Low-distortion source
  • Harmonic, band & sideband analysis
  • 100 kHz real-time bandwidth
  • Hardcopy output
  • GPIB and RS-232 interface
  • DC to 100 kHz bandwidth
  • 90 dB dynamic range
  • Low-distortion source
  • Harmonic, band, & sideband analysis
  • 100 kHz real-time bandwidth
  • Hardcopy output
  • GPIB and RS-232 interface
  • DC to 100 kHz bandwidth
  • 90 dB dynamic range
  • Low-distortion source
  • Harmonic, band & sideband analysis
  • 100 kHz real-time bandwidth
  • Hardcopy output
  • GPIB and RS-232 interface
          X

SR770 FFT Analyzer

Overview
The SR770 is a single-channel 100 kHz FFT spectrum analyzers with a dynamic range of 90 dB and a real-time bandwidth of 100 kHz. Additionally, it includes a low-distortion source which allows you to measure the transfer functions of electronic and mechanical systems.
          X

SR770 FFT Analyzer

Front Panel

          X

SR770 FFT Analyzer

              ... click for SR770 Tech Support

SR770 FFT Analyzer

The SR770 is a single-channel 100 kHz FFT spectrum analyzer with a dynamic range of 90 dB and a real-time bandwidth of 100 kHz. Additionally, it includes a low-distortion source which allows you to measure the transfer functions of electronic and mechanical systems. The speed and dynamic range of these instruments, coupled with their flexibility and many analysis modes, makes them the ideal choice for a variety of applications including acoustics, vibration, noise measurement and general electronic use.

High Dynamic Range

The SR770 has a dynamic range of 90 B. This means that for a full-scale input signal, the instruments have no spurious responses larger than -90 dBc (1 part in 30,000). Even signals as small as -114 dBc (1 part in 500,000) may be observed by using averaging. The low front-end noise and low harmonic distortion of the SR770 allows you to see signals that would be buried in the noise of other analyzers.

Powerful Processing

The SR770 uses a pair of high-speed,
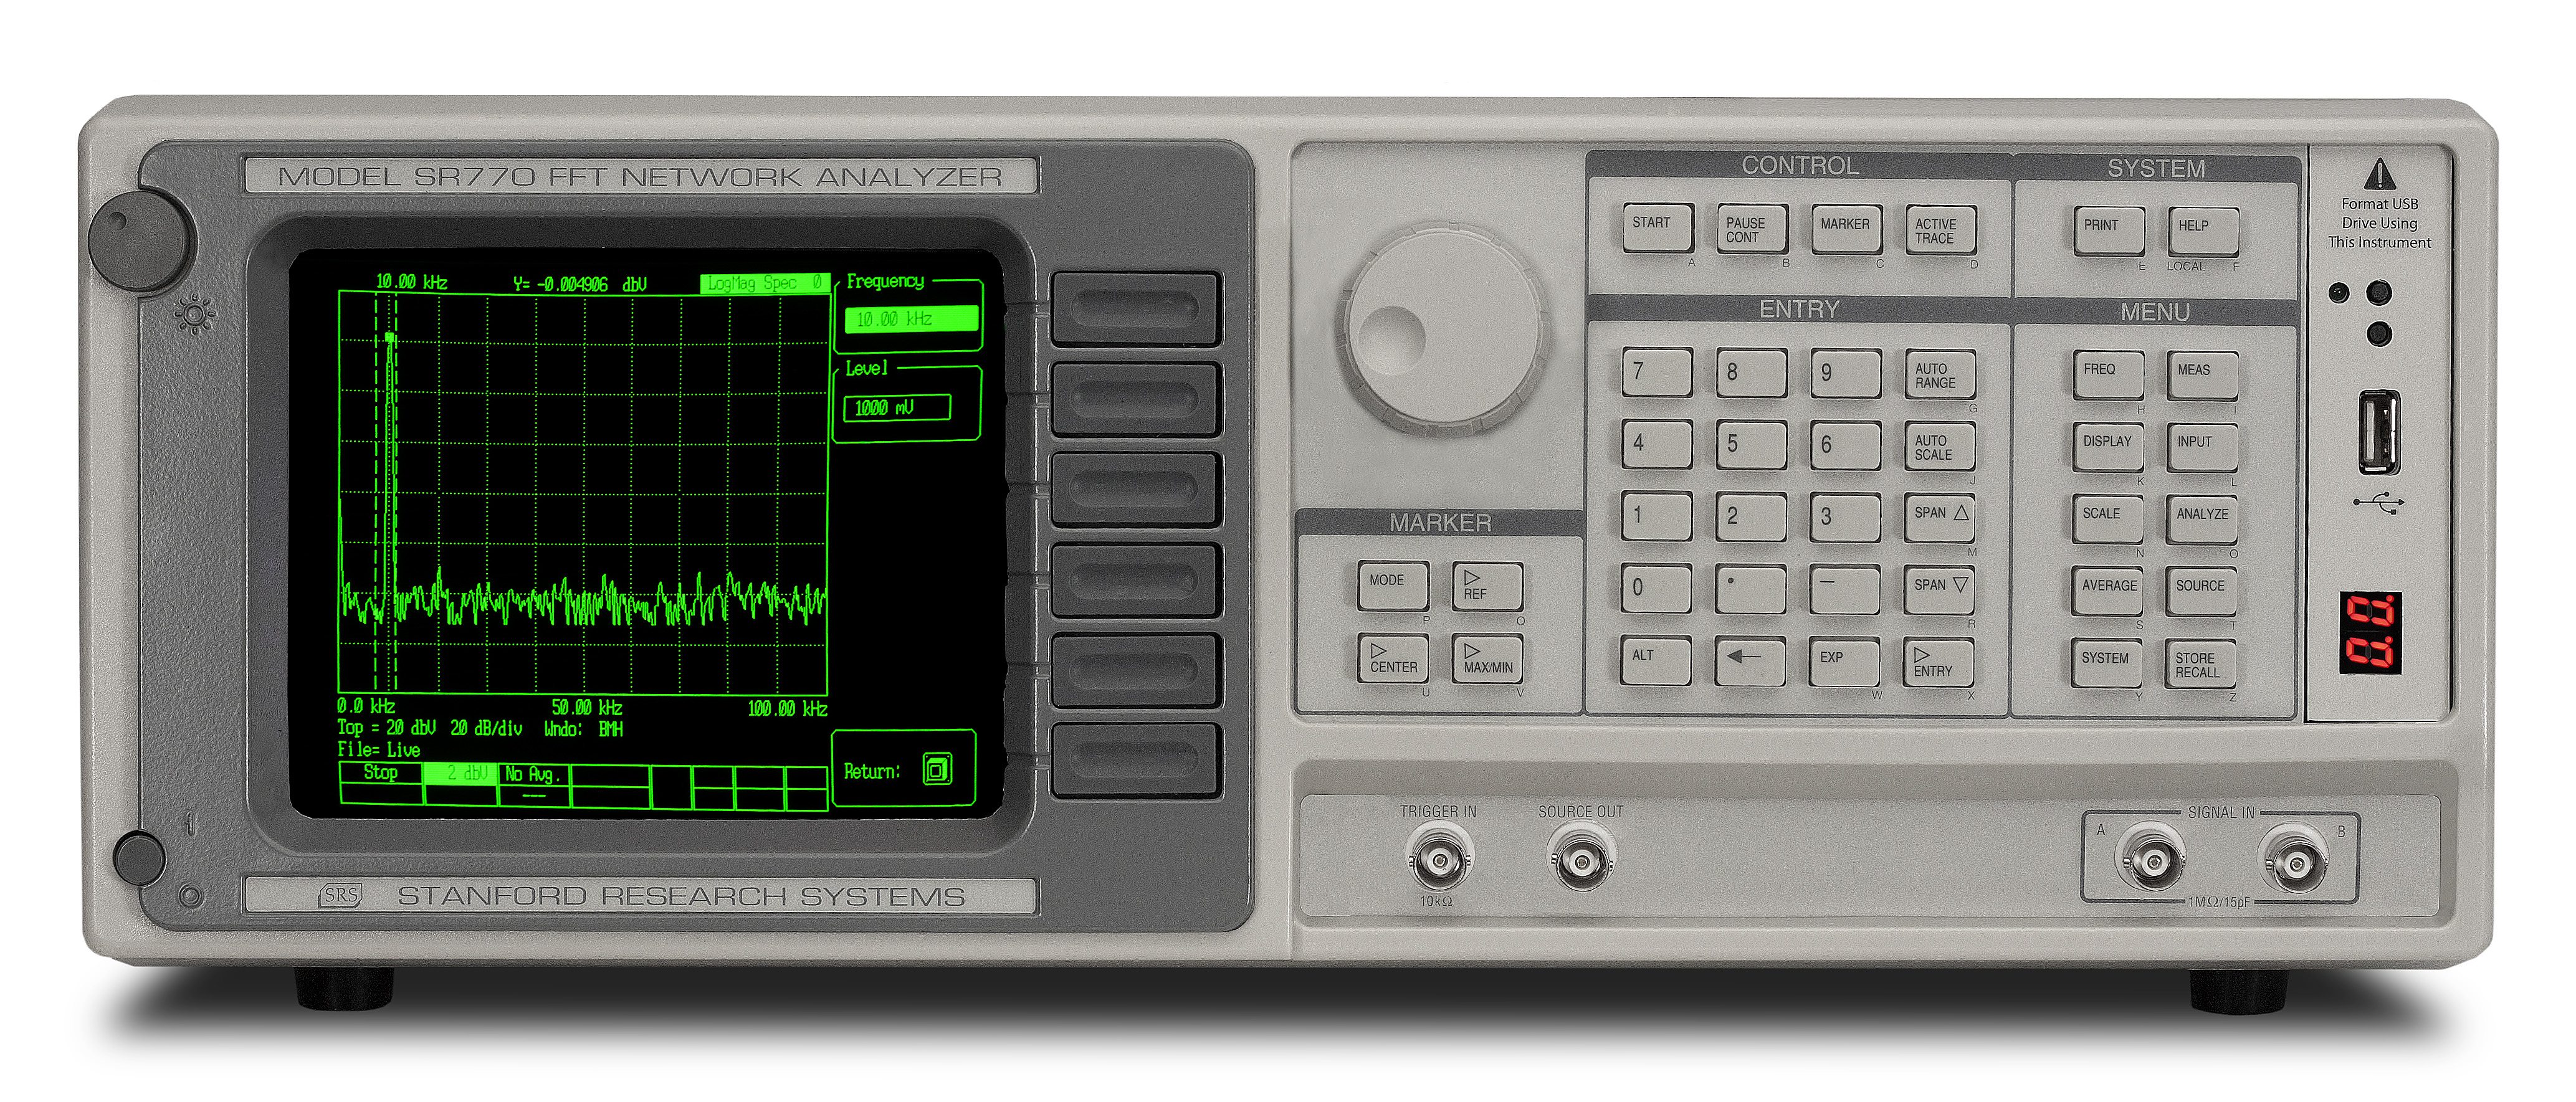
 24-bit digital signal processors (DSPs) to filter, heterodyne and transform sampled data from its 16-bit analog-to-digital converter. This computing capability allows the analyzers to operate at a real-time bandwidth of 100 kHz. In other words, the SR770 processes the input signal with no dead time. Your measurements will be done in as little as a tenth of the time of other analyzers, which typically have a real-time bandwidth of about 10 kHz.

Easy To Use

The SR770 is easy to use. The simple, menu-oriented interface logically groups related instrument functions. Context-sensitive help is available for all keys and menus, and entire instrument setups can be saved to disk and recalled with a single keystroke.

Spectrum Measurements

The spectrum, power spectral density, and input time record can be displayed in a variety of convenient linear and logarithmic units including Vp, Vrms, dBVp, dBVrms or user-defined engineering units (EUs). The magnitude, phase and real and imaginary parts of complex signals can all be displayed. Several window functions including Hanning, Flat-Top, Uniform and Blackman-Harris can be chosen to optimize in-band amplitude accuracy or minimize out-of-band side lobes.

Octave Measurements

The SR770 also computes both the 15 and 30 band 1/3 octave spectra, commonly used in acoustics and noise measurement applications. A-weighting compensation is available for octave measurements. Amplitudes are computed for band -2 (630 mHz) through band 49 (80 kHz).

Triggering and Averaging

Flexible triggering and averaging modes let you see signals as low as 114 dB below full scale. RMS averaging provides an excellent estimate of the true signal and noise levels in the input signal, while vector averaging can be used with a triggered input signal to actually reduce the measured noise level. Both rms and vector averaging can be performed exponentially, where the analyzer computes a running average (weighting new data more heavily than older data), or linearly, where the analyzer computes an equally weighted average of a specified number of records. Triggering can be used to capture transient events or to preserve spectral phase information. Both internal and external triggering are available with adjustable pre-trigger and post-trigger delays.

Synthesized Source

The SR770 includes a low-distortion
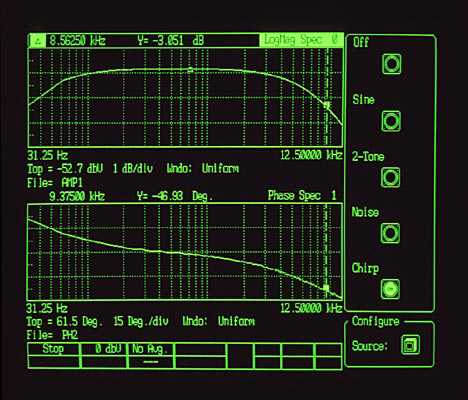
 (-80 dB), synthesized source which can be used to make frequency response measurements. It generates single frequency sine waves, two-tone signals for intermodulation distortion (IMD) testing, pink and white noise for audio and electronic applications, and frequency chirp for transfer function analysis. This direct digital synthesis (DDS) source provides an output level from 100 µV to 1 V, and delivers up to 50 mA of current.

Transfer Function

          X

Transfer Function

SR770 FFT Analyzer

Frequency Response

With its low-distortion DDS source, the SR770 is capable of performing accurate frequency response measurements. The source is synchronized with the instrument's input allowing transfer functions to be measured with 0.05 dB precision. The SR770 measures the magnitude and phase response of control systems, amplifiers, and electromechanical systems, and displays the resulting Bode plot.

Limit and Data Tables

Sometimes it is important to keep track of a few key portions of a spectrum. Data tables allow up to 200 selected frequencies to be displayed in tabular format. Automated entry makes it easy to set up data tables for harmonic or sideband analysis. Convenient limit tables allow the entry of up to 100 separate upper or lower limit segments for pass-fail testing. On exceeding a limit, the analyzers can be configured to generate a screen message, an audio alarm, or a GPIB service request.

Analysis Modes

Three built-in analysis modes simplify common measurements. Harmonic analysis computes both harmonic power and THD (Total Harmonic Distortion) relative to a specified fundamental. Sideband analysis lets you compute power in a set of sidebands relative to the carrier power. And band analysis lets you easily integrate the power in a selected frequency band. All three analysis modes provide clear, on-screen markers which make it easy to pick out frequencies of special interest, such as harmonics or sidebands.

Markers

The SR770 has a marker that is designed to be fast, responsive and flexible. The marker can be configured to read the maximum, minimum or mean of a selected width of display, or can be set to tracking mode to lock on to a moving peak. Delta-mode readouts let you easily view frequency or amplitude differences between two peaks. Automated peak-find lets you quickly move between the peaks in a spectrum. And the markers for the upper and lower displays can be linked to display similarities or differences in the two spectra.

Math Functions

Data taken with the SR770 can be processed with the built-in trace calculator. Basic arithmetic functions such as addition, subtraction, multiplication, division, square roots and logarithms can be performed on traces. Traces can be combined with other on-screen traces, or with traces stored on disks. These calculator functions are quite useful for performing background subtraction or normalization of data.

Flexible Storage and Output

All traces, data tables and limit tables can be stored using the USB drive. Data can be saved in a space-saving binary format, or an easy-to-access ASCII format for off-line analysis. A variety of hardcopy options let you easily print data from the instruments. The screen can be dumped to a
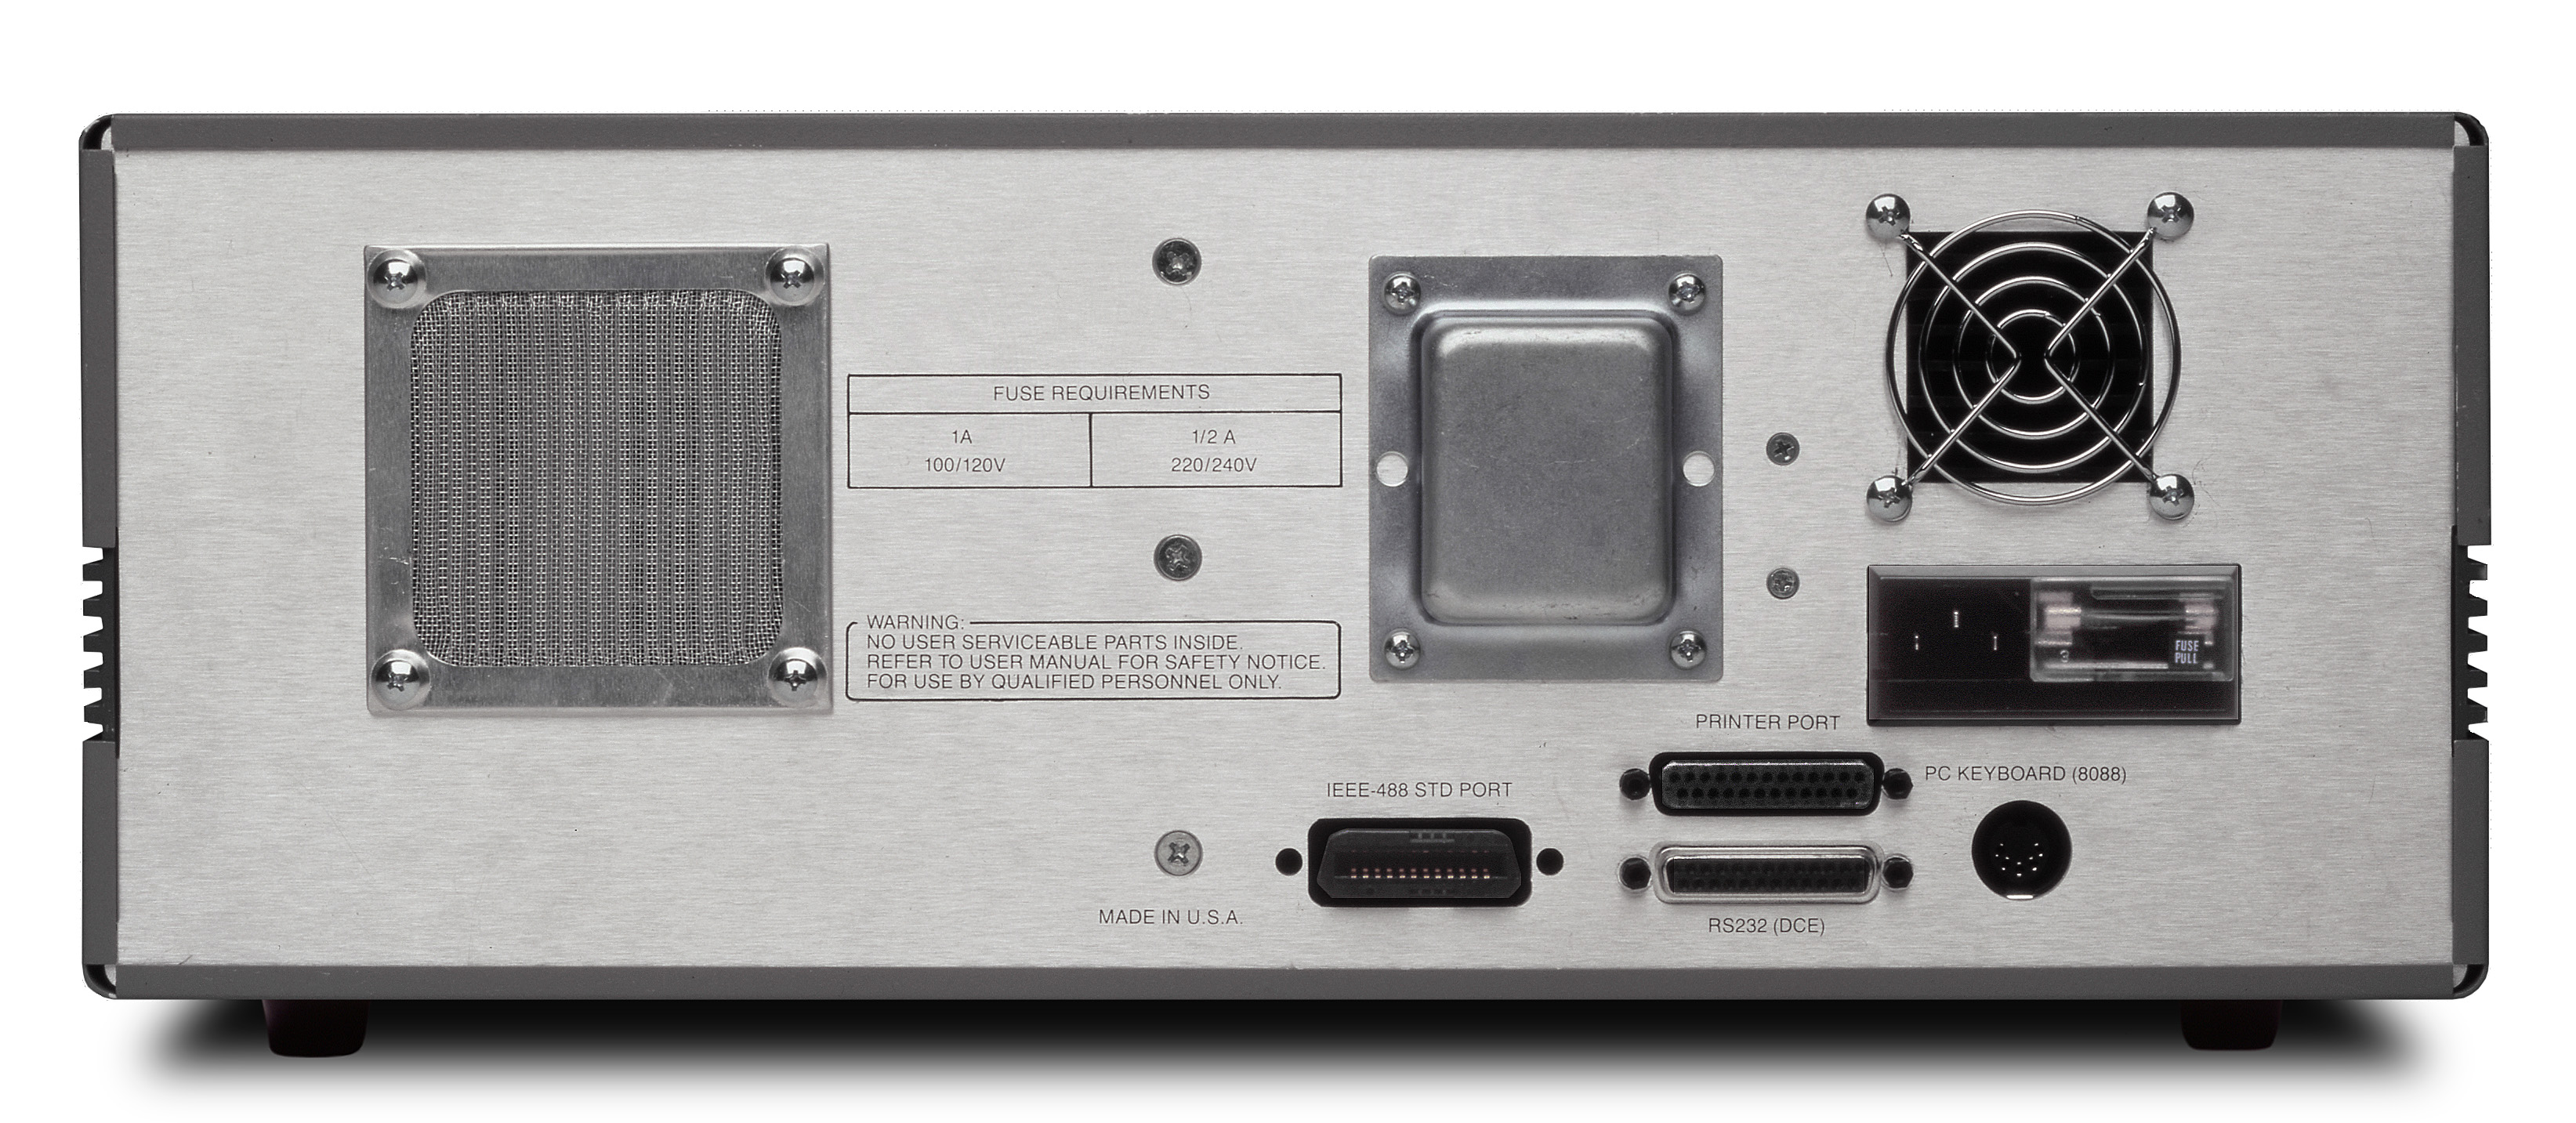
 dot-matrix printer or a LaserJet compatible laser printer via the standard rear-panel Centronics printer interface. Complete limit and data tables, as well as a summary of the instrument settings, can be printed. Data can be plotted to any HP-GL compatible plotter with an RS-232 or GPIB interface.

Easy to Interface

All functions of the analyzers can be queried and set via the standard RS-232 and GPIB interfaces. A comprehensive set of commands allows complete control of your analyzer from a computer. Data can be quickly transferred in binary format, or more conveniently in ASCII format. The complete command list is available as a help screen in the instruments for convenient reference while programming.